Data Discovery
Profiling is a way of Rendering Validation Results to produce a summary of observed characteristics. When Validation Results are rendered as Profiling data, they create a new section in Data Docs. By computing the observed properties of data, Profiling helps to understand and reason about the data's expected properties.
To produce a useful data overview, Great Expectations uses a profiler to build a special Expectation
Suite. Unlike the Expectations that are typically used for data validation, expectations for Profiling do not
necessarily apply any constraints. They can simply identify statistics or other data characteristics that should be
evaluated and made available in Great Expectations. For example, when the included BasicDatasetProfiler
encounters a numeric column, it will add an expect_column_mean_to_be_between expectation but choose the min_value and
max_value to both be None: essentially only saying that it expects a mean to exist.
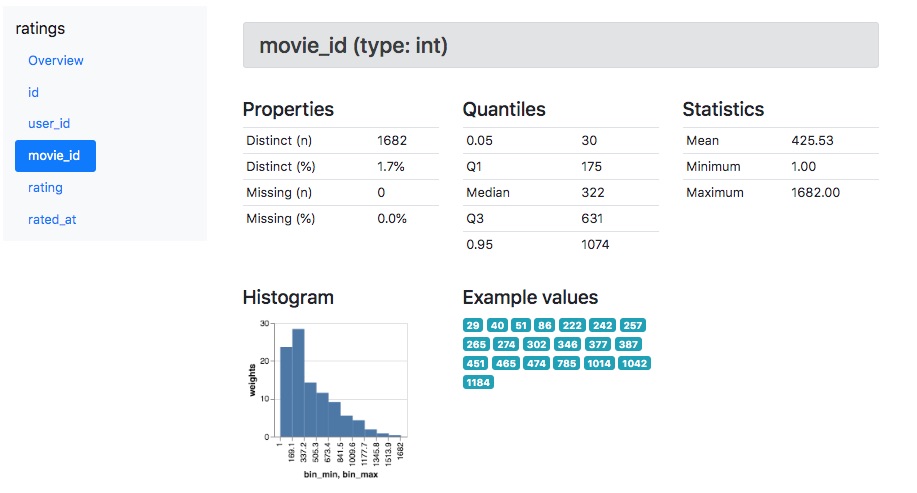
The default BasicDatasetProfiler will thus produce a page for each table or DataFrame including an overview section:

And then detailed statistics for each column:

Profiling is still a beta feature in Great Expectations. Over time, we plan to extend and improve the
BasicDatasetProfiler and also add additional profilers.
Warning: BasicDatasetProfiler will evaluate the entire batch without limits or sampling, which may be very time
consuming. As a rule of thumb, we recommend starting with small batches of data.
See the docs on Profilers for more information.